Workflow guide
What is that manual workflow actually costing you?
A process can feel expensive without anyone knowing where the cost sits. Map one real workflow, measure its friction, and decide whether a change is worth making.
Calculate the Cost of a Manual Workflow
Pick one start and one finish
Name the trigger that starts the work and the observable result that ends it. For client onboarding, the trigger might be a signed agreement and the finish might be a customer who has access, a named owner, and a completed first handoff. Without boundaries, every team member will count a different process.
Follow one recent instance from beginning to end with the people who actually did the work. List the systems they opened, the information they copied, the approvals they waited for, and the places they had to ask for status. Record the path that happened, not the process diagram everyone hopes happens.
Measure four kinds of friction
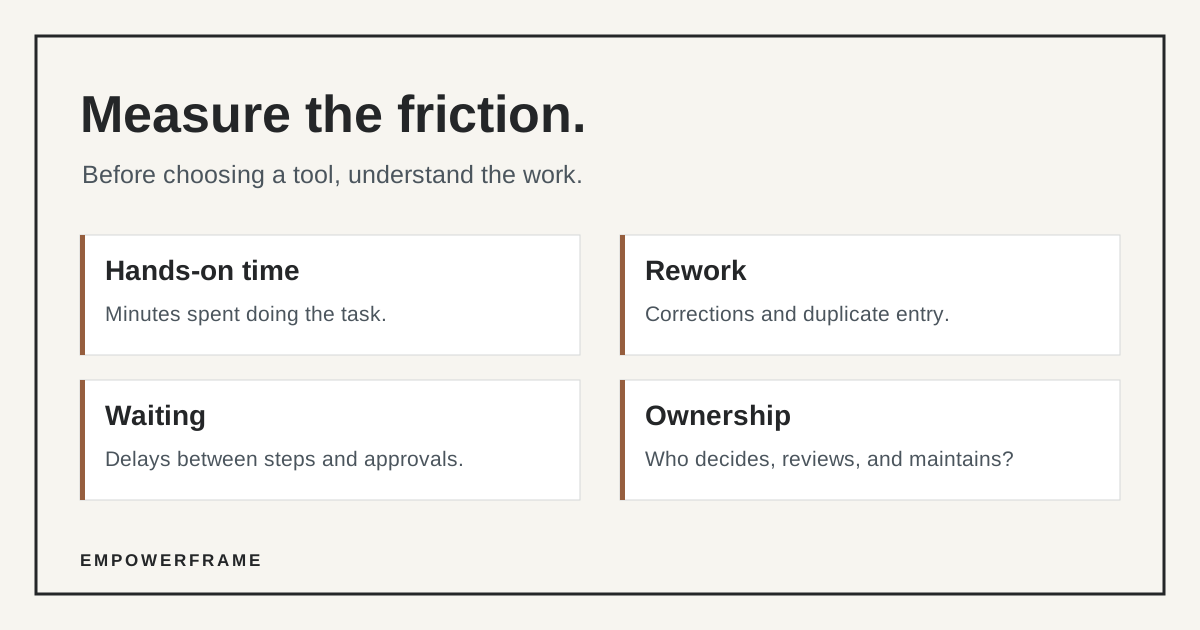
Hours saved are useful, but they are only part of the picture. Keep time, rework, delay, and risk separate so a guessed dollar total does not hide the real reason to act.
Hands-on time
Count minutes spent entering data, preparing updates, chasing approvals, and reconciling records. Multiply by the number of times the workflow runs. Use a fully loaded labor cost only when you have a defensible figure; otherwise report hours.
Rework
Count corrections, duplicate entries, missed fields, and reopened tasks. Note how often they occur and how long each repair takes. Avoid treating every mistake as a lost sale unless you can trace that outcome.
Waiting time
Measure elapsed time between handoffs and approvals separately from labor time. A two-day queue may use five minutes of staff time but still delay a customer or a decision.
Control and ownership
Identify where no one knows who approves an exception, which version is authoritative, or whether an automation ran. These may deserve attention even when the time savings look small.
Calculate a baseline without pretending it is precise
A useful first pass is: monthly volume × average hands-on minutes ÷ 60. Do the same for rework: monthly errors × average repair minutes ÷ 60. Keep waiting time as a separate measure. Record the source and date for every input, and use a range when the work varies widely.
For illustration only: if a task happens 40 times a month and takes 12 hands-on minutes each time, it consumes about eight staff hours a month. That does not mean an automation would save all eight hours. Design, review, exceptions, monitoring, and adoption also take time.
Decide what to fix before choosing a tool
Look for the earliest avoidable handoff, duplicate entry, or missing decision rule. Sometimes one shared source of truth or a clearer owner removes more friction than AI. If the process is unstable, redesign it first; otherwise you may automate the variation and make it harder to see.
Then ask what still requires judgment, authorization, or a person who is accountable for the outcome. Use rules for predictable decisions, AI for interpretation or drafting where it is appropriate, and people for approval when consequences matter. Set a new baseline after the change and compare volume, time, rework, delay, and adoption against the original measures.
A 20-minute workflow worksheet
You can capture enough evidence for a first decision on one sheet. Ask a process owner and a person doing the work to complete it together.
- Boundary
- What event starts the work, and what proves it is finished?
- Volume
- How often did it run last month? Where did that count come from?
- Hands-on time
- How many minutes did a typical instance take? What was the high end?
- Rework
- What was corrected or entered twice, and how often?
- Waiting
- Which approval or handoff added the most elapsed time?
- Ownership
- Who decides on exceptions and who will own an improved process?
If these answers are hard to get, that is a finding. Instrument the workflow before promising a return on automation.
Explore the next step
Next step
If several workflows compete for attention, the AI Opportunity Map compares them and produces a prioritized implementation plan.